Presentation
Introduction to GeoJupyter
GeoJupyter is a community, not software.

Figure 1:A diagram of the GeoJupyter community’s current and future projects.
Our mission is to enable more people to confidently engage with geospatial data.
To do this, we’re asking people about the way they work and how it makes them feel. Where are they frustrated? Where are they rewarded? We allow this input to guide our strategy instead of attempting to guess what to work on.
Our values
🤗 Open source!
👤 Human-centered design!
🤸 Approachability and playfulness, like desktop GIS tools
🪶 Flexibility and reproducibility, like coding
🎭 Collaboration and storytelling, like Jupyter Notebooks
How to be a part of our community and mission
📅 View or save our community calendar - Join a hackathon or community meeting!
🗨️ Chat with us on Zulip - Ask questions or share ideas!
🎤 Sign up for an interview - Tell us where you experience friction, frustration, joy, and/or payoff!
Introduction to JupyterGIS
JupyterGIS is the GeoJupyter community’s flagship project. It is a collaborative GIS tool built in to JupyterLab.
It features its own project file format, .jGIS, but also has limited support for QGIS
.qgz project files!
It can do many of the same things that QGIS can do: Manage many map layers, configure symbology, and identify features or grid cells.
It also has some capabilities out-of-the-box that QGIS doesn’t have: Google-Docs-like collaborative editing and comments (we call them “Annotations”), a layer browser with many cloud-native layers pre-populated, and seamless Jupyter Notebook integration. Soon, JupyterGIS will also have a STAC browser!
Streamlined data validation
One of the most common sources of friction reported by practitioners in GeoJupyter interviews was repeatedly switching between a Notebook environment and a point-and-click GIS environment (like QGIS and ArcGIS) to check their work.
These practitioners described a process with many steps, like a dance. We heard this so often, we gave it a name: “The GIS Bounce”.
We recently released a new feature which streamlines this process. Now, you can pass your data to JupyterGIS’ point-and-click GIS environment with one line of code.
from jupytergis import explore

explore(my_geodataframe)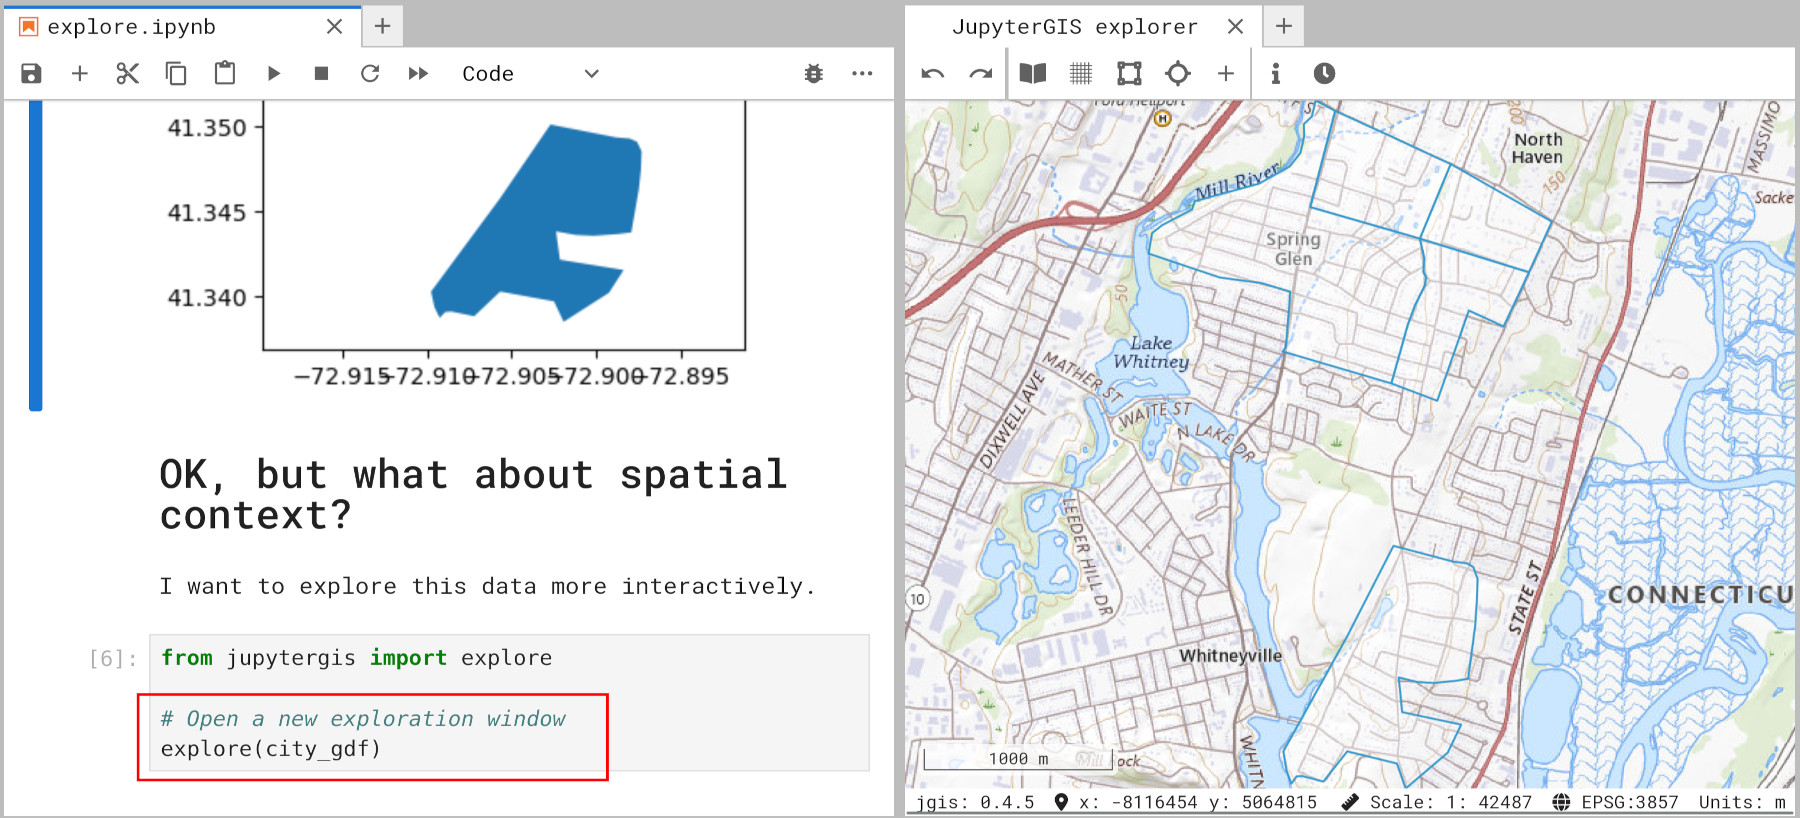
Figure 2:An example of exploring a GeoDataFrame with one line of code.